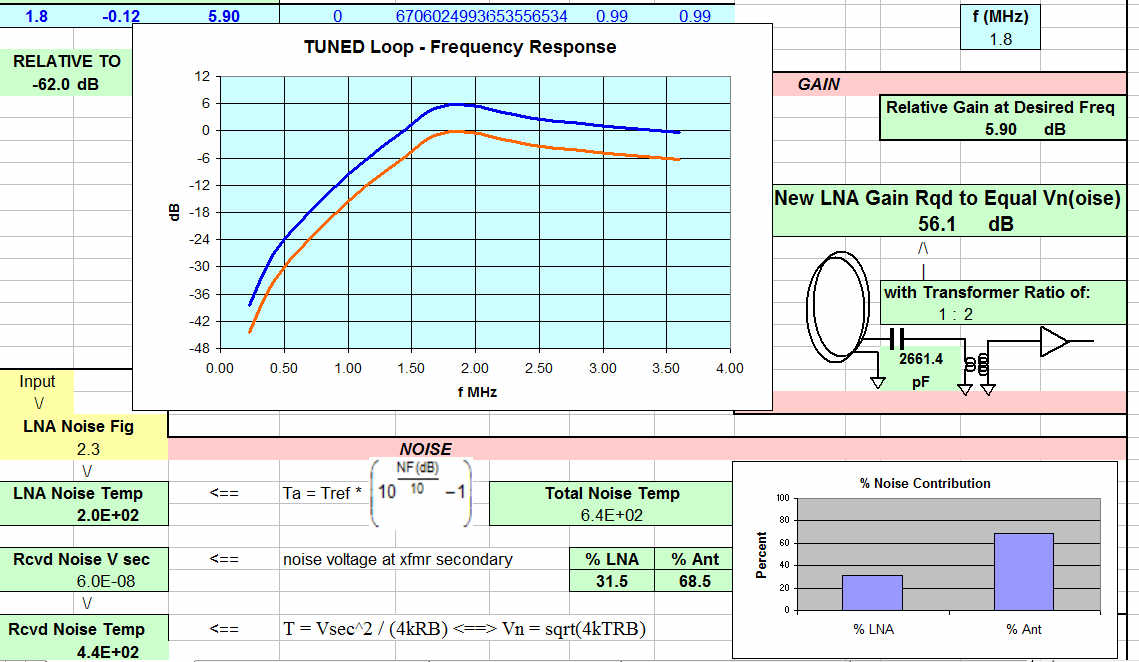
First cut at an Excel spread sheet to analyze a small RX loop’s noise and frequency response performance.
Ambient noise level
Frequency
Size
Wire gauge
Tuned / Untuned
Transformer / No Transformer
LNA noise figure
The contribution of LNA noise is compared to the received noise level to aid in choosing LNA noise figure and loop size. In addition, the loop can be tuned or untuned, and contain an input transformer.
Frequency response of the loop is also calculated and displayed.
All values are calculated and derived from a sort of “first principles” approach, first by calculating the received noise power level (noise temperature is read from an ITU table and entered into the sheet), then determining effective aperture. From these we now know the noise Power Density, and the E, H, and B fields.
From the B field and entered physical loop data, we determine the loop’s open circuit noise voltage. From there we determine loop resistance, loop inductance, losses, transformations, and frequency responses.
The ultimate value of loss at our chosen frequency gives us a received noise voltage and equivalent noise temperature. We compare against a chosen LNA’s noise figure to see if we have a low enough noise LNA and large enough loop.
Untuned and Series Tuned Loop Noise and Response Calculations – V1_5.xls
article and excel sheet copyright Dave KD6RF
2,610 total views, 3 views today
